2000 Year Temperature Comparison
Nov. 21, 2019, 10:30 a.m.
Creative Commons Attribution-ShareAlike (CC BY-SA)
Marcus Saperaud
English
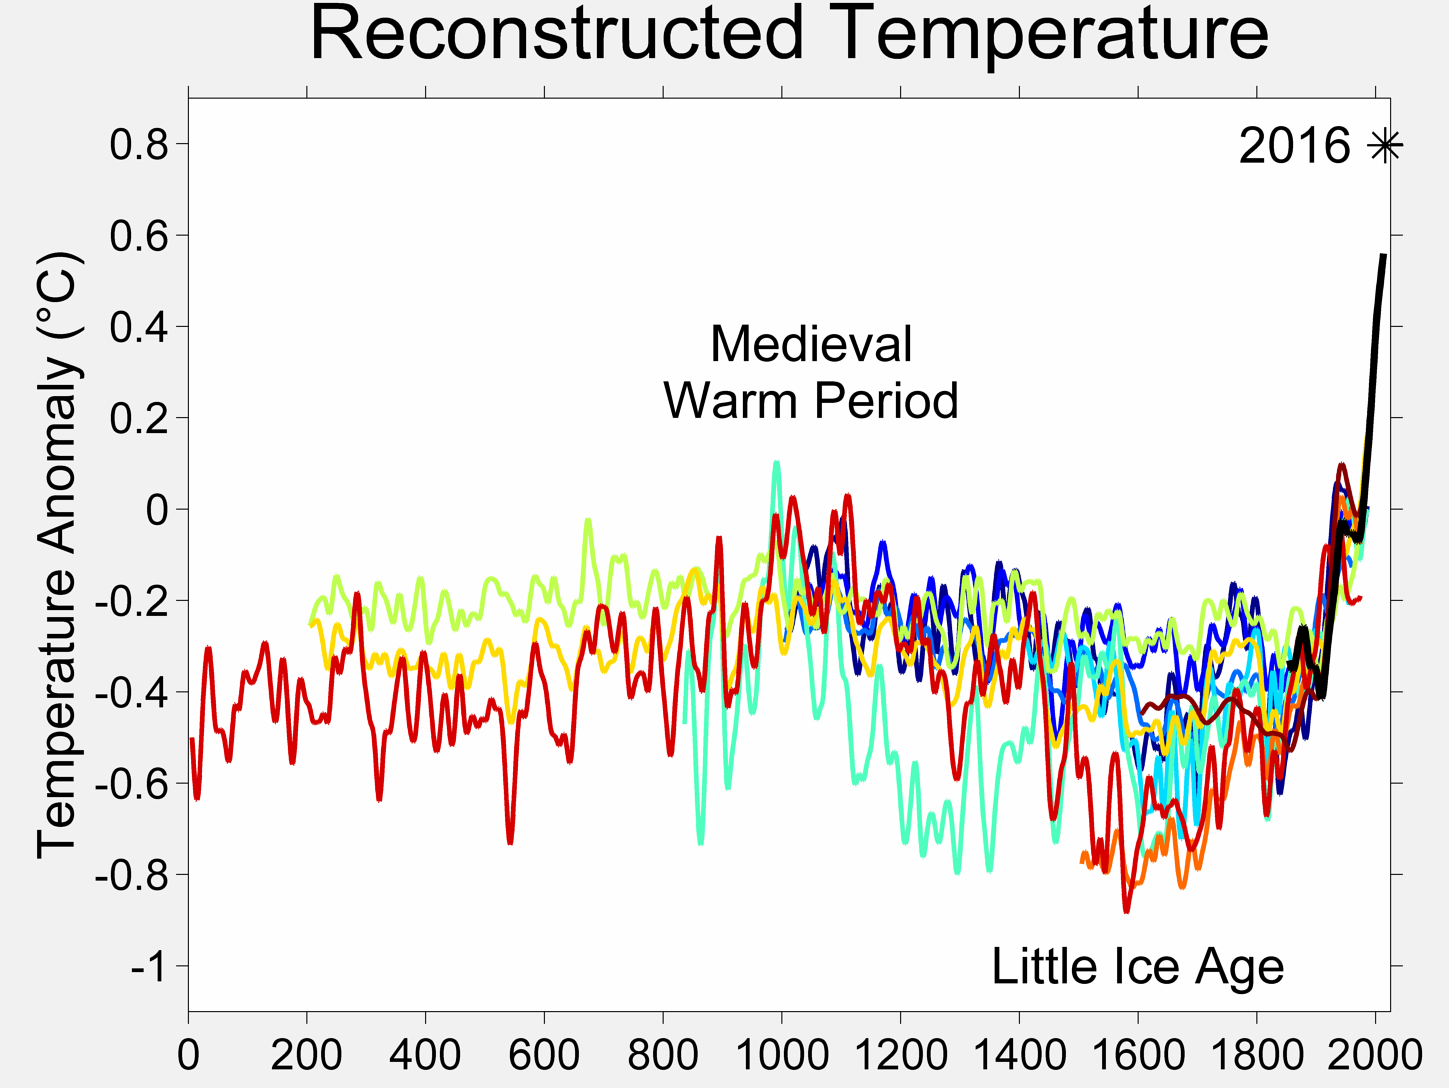
This image is a comparison of 11 different published reconstructions of changes during the last 2000 years. More recent reconstructions are plotted towards the front and in redder colors, older reconstructions appear towards the back and in bluer colors. An instrumental history of temperature is also shown in black. The medieval warm period and little ice age are labeled at roughly the times for which they have been postulated, though it is under dispute whether these should be considered global or merely regional events. The single, unsmoothed annual value for 2016 is also shown for comparison. (Image:Instrumental Temperature Record.png shows how 2004 relates to other recent years).
For the purposes of this comparison, the author is agnostic as to which, if any, of the reconstructions of global mean temperature is an accurate reflection of temperature fluctuations during the last 2000 years. However, since this plot is a fair representation of the range of reconstructions appearing in the published scientific literature, it is likely that such reconstructions, accurate or not, will play a significant role in the ongoing discussions of global climate change and global warming.
For each reconstruction, the raw data has been decadally smoothed with a σ = 5 yr Gaussian weighted moving average. Also, each reconstruction was adjusted so that its mean matched the mean of the instrumental record during the period of overlap. The variance (i.e. the scale of fluctuations) was not adjusted (except in one case noted below).
Except as noted below, all original data for this comparison comes from [1] and links therein. It should also be noted that scientific challenges to methodology and data used in several of the references have been substantiated and reconstructions of past climate report substantial error bars, which are not represented on this figure.
[1] https://www.ngdc.noaa.gov/
CC BY-SA - Creative Commons Attribution-ShareAlike